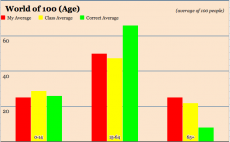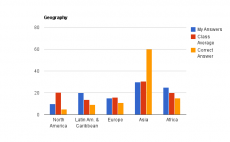
For most of the countries, my answers and the class averages aren't too terrible far away from the real answers. I knew North America wasn't too large of a part of the world, but I gave it too much credit. I also knew that Asia was a large part, but I didn't give it enough credit. At all. That's pretty much the first thing you see in my graph.
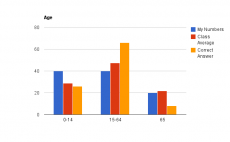
Here, I gave too much to the young and FAR too much credit to the old.
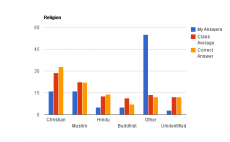
I thought that the "unidentified" would be such a small number because really only the US really has no problem with people not identifying with a religion. Wrong. Also, I thought that there would be a lot of smaller religions spaced out throughout the world, therefore I gave "other" a large number. It seems I underestimated Islam and Christianity on that part. Dominated.
Write an analysis of your answers as compared to the 'real' answers.
1. Which categories were you most accurate? inaccurate? Explain why you think that was the case.
I was most accurate on the gender category. I figured that the odds of a boy being born to a girl being born were pretty close to 50/50 just because of the genetics of it all. But, I remember someone telling me that there were more females in the world, so that is why I put 51% female and 49%. I was still pretty close to the real answer of 50% and 50%. It is kind of interesting to see where I was far from accurate such as with education. What I put was basically the opposite of the reality. I put 70% for both males and females for without secondary school education, and that number is true for those with secondary school education. I figured that a majority of each gender would have access to primary education, but I thought that number would decrease since a majority of the population needs to go and work and can't necessarily afford school. I see I was wrong here. I suppose it does make sense since a lot of countries do offer free education and the value of education has been rising as more and more people realize that the higher education one has, the higher paying job they will receive.
2.Which of the real/correct answers shocked you the most? Explain.
To be honest, the poverty, drinking water, and technology categories surprised me the most. I was always raised to appreciate what I have because most of the world doesn't have access to what I would call luxuries like clean water and technology. In classes and on television, a lot of attention is paid towards those living in poverty. So, I always thought that well over half the world population lived in poverty and therefore did not have access to clean drinking water and technology. Well, I was wrong. Only 48% of the population is in poverty, and while yes the number of those who are rich is such a small number probably compared to that, the middle class (working people) probably dominate the population.
3. If you were way off course in your predictions, explain why it is that you feel that happened. If you were spot on, explain why you think that happened. - due by class on Friday - 2.10.2012
I suppose the only knowledge I have of the world comes from what my parents and teachers taught me and what television has shown me. But these views are often one-sided and do not portray the entire world as a whole. So, my own estimations at the numbers get messed up as a result.