World of 100

The first graph shows my personal, average, and correct answer of the percentage of different age. It is interesting because it really shows how big the difference is between three sets of data. I never thought that there is that much percentage of people between the age of 15-64.

The second graph is a chart about how many people around the world doesn't have electricity as power. The average of the entire class is really funny because it is kind of the same percentage. My personal answers are closer to the correct answers than the average.

The third graph is about the religion percentage around the world. In this graph I considered the percentage of Christians too high and other religions too low. The average answers from the class are similar to the correct answer. I think this is because they know more about Christianity.


Analysis
1. I am most accurate in the electricity section, and I am most not accurate in the section of diversity of age. For electricity section I think it is because the some people are too passive about the world right now. For the age section I think it is because I came from China and have an understanding of a Chinese. In China, we have a great percentage of children being born and large amount of senior aged people.

2. For me, I think the percentage of people between the age of 15-64 shocked me most, because I first thought that if a family have at least two child, that means they have more children to raise and more senior aged people to take care.

3. I think I am a bit off course. For example, the percentage of Christians around the world, I got about 10 percents of difference. I think this is because I am not familiar with Christianity. I don't even know the possible percentage of Americans who are Christians.
chart_6(1)
chart_6(1)

SLA

Clase: Inglés 
Profesor: Sr. Kay
Actividad: Hablar sobre nuestro vida, en clase lectura, y escribir
Como necesitamos: El kindred libro
Que necesitamos de: A leer fe tarea y trabajar en la clase

Clase: Bioquímica 
Profesor: Sr. Sherieff
Actividad: Trabajar en grupo proyecto, investigacíon, y discusíon
Como necesitamos: Un pluma
Que necesitamos de: A tomar notas y dibujar lo que somos laboral en


World of 100


The category in which I was the most accurate is "Literacy By Gender". Out of all three of my categories this was the closest of the three to the correct number most likely because of my middle school experience. I had a very different middle school experience mainly because the school was segregated if you will into to sides. One side of the middle school, was comprised of students individually selected from other school around the district because my middle school was a magnet school. While the other side was comprised of students who attended the school in elementary school and didn't qualify to be in the magnet program due to their grades, behavior, etc. The majority of the students in the magnet program were academically gifted and their literacy rates reflected that. And the students in the regular side of the middle school had grades that were rather mediocre and when I weighed out the students in the middle school from both sides, academic and regular, I felt it gave me a fair representation of male literacy rate on a larger scale
.

The correct answer that shocked me the most was the correct number for "Access to Clean/Safe Drinking water". We live in a society where recycling and conservation is almost second nature and we act as though there is a majority of the world that doesn't have access to safe/ clean water like we do in America. I felt like to have 87 of 100 people have access to clean/safe water that shows that we as a human race have been doing our part in conservation and the pollution rates have come down because years ago this was a serious problem that was taken seriously worldwide

I ended up being way off in my predictions compared to the correct/real answers. I think this is because certain morals & values were used to teach me respect and many of them are slight exaggerations of what is real. We are taught to be good standing citizens so that throws off our perception of what the real world is like and my personal opinion 

World of 100

chart_6
chart_6

 I was accurate for the hindu, Buddhist, and atheist aspects of religion. I guessed for these religions so my accuracy was just by chance but I think I was so inaccurate for the others because I haven't really ever thought about these things. I was surprised that the Urban and Rural dwellers are almost equal, I thought that since there was much more space rurally but less people to each space, much more people would live in cities. I guess the ages didn't really surprise me because the 15-64 gap is much wider than the other two classes. I thought I was going to be relatively correct but I wasn't so I don't know why. 


chart_5
chart_5
correct_class_average_and_my_answer_

World Of 100

The Graphs:
World Language- If you look at this graph you can see that not a lot of languages went over the 20 mark other than the other category which I think is interesting because some of these languages are common and to think that the "other" category was higher brings forth the question what in fact are those languages?; I thought it was also interesting that the majority of my classmates had the same idea when it came to looking at the world and what languages they thought would be most frequent.

World Geography- With this graph I noticed that the numbers for myself, the class and the correct answers seemed to favor North America which to me made sense because a lot of other nationalities come over from time to time to America to start over and so the fact that these numbers are higher than other places around the world doesn't really surprise me as much.

World Age- This graph shocked me just a bit because I would assume that because babies are always being born that there would be more infants in the world but then I looked at different variables that could make it so that teens to 64 year olds were a lot higher in numbers.


Which categories were you most accurate? inaccurate? Explain why you think that was the case.

I really wasn't that accurate in much of anything with the categories because I really didn't put much thought into the idea of it being the "world" and just put thought into ideas about the world that I knew without deeper knowledge.

Which of the real/correct answers shocked you the most? Explain.

The answer that shocked me the most was the one found in language and where it said other languages would be used more than other common languages like Chinese and English or even French, I thought that was interesting because that to me showed the diversity of language throughout.

If you were way off course in your predictions, explain why it is that you feel that happened. If you were spot on, explain why you think that happened.

I believe that I was off course in my predictions because I assumed that what I looked at the world as and how I related with the world by which what I've been told would always be correct and not wrong as well as what I had read to be correct. Even when I made a slight change I saw that I was still off because it still followed the ideas and assumption of things that I was told.
Screen Shot 2012-02-10 at 8.33.41 AM
Screen Shot 2012-02-10 at 8.51.09 AM
Screen Shot 2012-02-10 at 8.52.04 AM

100. Gonzalez


 In most cases aside from clean and dirty water. I thought a lot less of the world had access to clean water when in reality about 80% or more of the world had access to it.
chart_5
The one that shocked me the most had to be the water. I thought with all of the third world countries thatclean water would be hard for them to access.

chart_4 (1)
I thought that all the third world countries had a harder time getting to clean water. I was spot on with most languages because while growing up i've gone to pretty diverse schools and I just kind of went along with the make up of the schools from my perspective
.chart_4


Sinopsis

Clase: Bioquimica
Profesor: Señor sherif
Actividad en la clase: Escribier, experamimentes, bailar musica
Responsibildades: trabajar duro
Materiales: el libro, el lapiz, el cerebros
Opinion: fascina, interessante, importante


Clase: inglès
Profesor: Señor Kay
actividades en la clase: leer, conversacíon, tarea
responsibilidades: trabjar duro, leer, estudiar
materials: el lapiz, papeles, el libro, la computadora
Opínion: importante, comico, interesante
Screen Shot 2012-02-10 at 7.50.19 AM

World Of 100

The interesting thing here on this graph is how many other languages there are in the world because even the number of Chinese speakers is very low and that is the highest percentage.

Screen Shot 2012-02-10 at 1.56.11 AM


This was one of my more accurate ones besides other and christian.
Screen Shot 2012-02-10 at 1.55.45 AM
 
It was interesting to me how many people were from Asia in this geography statistic.  I had no clue that 62% of all people live or are from Asia.
Screen Shot 2012-02-10 at 1.55.57 AM
 

 I was pretty much off in most situations but I was pretty accurate in the religion section. I think this is because I see a lot of diversity in religion in Philadelphia so it sort of represents a world scale. The section that surprised me the most was the Asia for geography, or maybe even geography as a whole surprised me the most. I honestly didn't think that so little live or are from North America and that such a number live or are from Asia. I personally think that I was so off-course because I tried to stay modest in all of my answers usually suppressing my first answer. Despite that I still think that I could not really think in terms of the whole world because I have only seen certain parts of the world which make me think of terms of my world, not the whole world.

World of 100 Analysis

World of 100 Geography
The graph above shows the percentage of the distribution of the world's population by regions. For this category, I was pretty close with the predictions. It is interesting to see that the places that are occupied my more people are generally more economically disadvantaged, namely Asia and Africa. However, it is also important to know that Asia is the largest continent geographically, and Europe is relatively small comparing to others, as it would help explaining the gaps of population between continents. 
World of 100 language
​The graph of language was tricky, as there was an overwhelming number of choices. On top of that, the English language centric view and the lack of multilingual perspective resulted in clear gaps between my personal view and the correct answer. It is especially interesting to see how class's average for English is way off the actual result. 
World of 100 Religion
​This is probably the most precise graphs out of all three, where answers have the least gaps. It might be because of the multi-religious presence in the US that created the view. 

1. I was most accurate in Gender and Age. I think it is because of the highly exposed information about this category that I was able to get the answer correctly. However, I was not very accurate in categories about education and technology. I believe this is plainly due to my lack of knowledge on the question as I never inquired on the matter. 

2. I think I was shock the most in finding out the percentage of cell phone users vs. the percentage of people who live under $2 a day. I think that it is fascinating how technology has become an extremely integral part of human's function that it is used across the board despite the level of poverty. 

3. I was way too of course on the category of urban vs. rural dwellers. I predicted that 95% of the world population would live in an urban area. Although deep down I know that it is not true, but it is hard to resist such though when all places I have been to in the past fews years are urban areas.  

World of 100- S.Kabangai

​Samuel Kabangai

chart_7
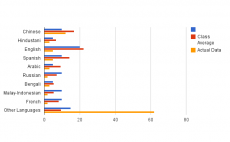
  1. For the language portion, I feel as though I was pretty close with the actually data. During the process, I was thinking about the people that I know and also the information that I know based on languages around the world. I was surprised to see that there were more people in the world who speak Chinese other than english.

    chart_8

    I may say that for the geographical locations, I was not as accurate as I though I was. I did not base my estimations on any facts but only my thoughts which came from my surroundings. After I saw the graph for the real data answers I was not surprised because the result made sense. At the time when I was filling out the data, I knew that China was the most populated, but I didn't know that their population was that much in order to alter results like that and have amount in the data.

    chart_9

    In the Religion category, I did not know much about each and every religion to make my predictions, thats why I think that my guesses were soo off. I was surprised to see that Christianity have a higher level. I was surprised because based on older information that I new a couple years ago, the nation of Islam was more populated and I did not know that the information changed.

World of 100

For a class of at least 32-34 students we had to deiced what the rest of the world would be like if there were only 100 people. The sheet of paper that we had to give our estimations on included a lot of possibilities and diverse features of civilization. So each student wrote down their estimation of how the World of 100 would stack up. 


Screen Shot 2012-02-09 at 10.33.02 PM

Screen Shot 2012-02-09 at 10.33.15 PM

Screen Shot 2012-02-09 at 10.33.26 PM

World of 100 Analysis

chart_4
chart_4
This is a bar chart including the answers to questions concerning males and secondary education in the world. According to this chart, my perception of how many males have access to a secondary education is pretty low, compared to the correct answer, however the class average is even lower. I believe that what these results show is a poor perception of education from my classmates and I, which could probably be attributed to us being from Philadelphia. Philadelphia has great colleges and universities, however, often times various neighborhoods lack access to quality schools.Since education isn't that great in Philly and even in America, I assumed that it was much worse in other countries, which may have influenced my answers and made them lower than the correct answers.
chart_5
chart_5
This bar chart shows the results to the questions concerning females and secondary education. Again, as with males and secondary education, my answers were much lower than the correct ones. My reasoning from the previous question can also be applied here, yet what shocked me was how equal girls and boys were when it comes to receiving a secondary education. I thought that girls were less likely to receive a secondary education, because I know that in many underdeveloped countries girls are more likely to have children and stay home than boys. However, I guess that my perception was off because girls receive a secondary education at around the same rate as boys. It's interesting that in both questions, I thought that the percentage of girls and boys that didn't receive a secondary education was much higher than the actual rate.
chart_6 (1)
chart_6 (1)
This is a bar chart with the answers to the question about world languages. What surprised me the most after seeing the correct answers was how many people speak other languages in relation to the most "prominent" languages in the world, and also how few people speak English. The reason behind my extremely off answers could be due to the American complex that I have, which basically has skewed my perception into thinking that because America is so important and big globally, then of course there should be a large percentage of people in the world speaking English. This complex definitely influences the way I and other Americans see the world, and  is probably why I was shocked to see that only 5 people out of 100 people would speak English.

1) Out of the three categories that I chose to focus on, none of my answers for them were accurate. This was a bit surprising because I've always thought of myself as fairly knowledgeable when it comes to the world's geography and demographics, however these results shown in the graph are evidence of how little I actually do know about the world's demographics. I think this might have been the case due to my lack of research on countries beyond the United States, Latin America and Africa.

2) The real answers that shocked me the most were the amount of people with access to clean drinking water and the percentage of people living in urban versus rural areas. I thought that only developed, wealthy nations had access to clean drinking water, yet surprising over 80% of the world does. This was a shock compared to all the images of poor countries with polluted water that I had been accustomed to. Also, I was surprised to see that roughly the same amount of people live in rural areas as in urban areas. I just assumed that more people lived in rural areas because in my mind, the entire world is made of rural places with few spots of cities, but I see now that this perception was off.

3)I think that the biggest reason behind my inaccurate predictions can be explained by the 'American complex'.

World of 100 Analysis


I was shocked at the overall data for those living on less then 2USD because my answers and the overall class average are roughly close to each and the correct averages were at about 47. I found it interesting that my answers were considered the highest because I was expecting a majority of people to live on less then 2USD where in reality and according to the correct answers it is actually fairly lower then my average and the class average. I was expecting the correct answers to be fairly high like my average. The data set for those living on more then 2USD shocked me as well because considering the fact that there are only 100 people living in the world I would expect, not many living on 2USD. I was surprised when the correct answers showed to be higher then 50 people living on more then 2USD. The class average seemed fair to me because it was in between not to little and not to much. 


The literacy levels for the males who are able to read and write didn't shock me as much because I was right on task. I was roughly close and I had a good overall understanding although I wasn't as close to the correct answers. I didn't feel like anything could have been changed for my answers or the overall class average because of the different opinions people put into it. The males who are unable to read and write surprised me because I was expecting the correct answers to be similar to my results and to the class averages but the outcome turned out to be the exact opposite. The correct answers resulted in having a fairly low amount of males unable to read and write where I thought it would be significantly higher amount. The females who are able to read and write didn't surprise me considering the fact that the correct answers and my answers were similar to one another. Where the class average surprised me because it was lower then my average and the correct answers. The females who are unable to read and write surprised me as well because the correct answer and my answers showed similarities but I was confused by how off the class averages were.   


I was confused by my data because it my head it made sense to have a low amount of cell phone subscribers because previously I had assumed that there were very little, persons getting more then 2USD and therefore I assumed that the results I chose were relevant. The non cell phone subscribers caught me by surprise as well because my answers were fairly high and so was the class average but the correct answer were low. I believe that this happened because of my previous decision of the cell phone subscribers. I assumed the same thing for the internet users, the fact that I had chosen very little, persons getting more then 2USD and that if affected how many active and inactive internet users there are. I was surprised by high my answers were for the inactive users and how low they were for active internet users. The class average surprised me because the results from the class and the correct answers were fairly similar and at about the same place for one another. My results were the only ones off.

I would say the most accurate would probably be in the category of literacy involving the female gender. I think this was the case because in my head in the past many females were very intelligent and knew many things about learning how to write and read. I think that overall in this case that it made sense to me to have majority rules because there weren't many peoples to base it off of. The most inaccurate would probably be in the technology section involving cell phone users. I think this is because of the way I answered previous date involving the poverty rates.
The poverty levels shocked me the most because considering the fact that there are only 100 people I never thought to settle more then half of them on more then 2USD. I expected it to be fairly lower and I expected a majority of them to be living on less then 2USD.
I would say that I was on spot several times and way off at other times because throughout the results and the averages overall I realized that not everything I decided would match up and I knew I would be off. My results resulted in the way the did because of previous decisions I made on the previous topics at hand. I based my overall answers on other topic answers I have chosen.

World of 100 Analysis

chart_4
chart_4
This is a bar chart including the answers to questions concerning males and secondary education in the world. According to this chart, I my perception of how many males have access to a secondary education is pretty low, compared to the correct answer, however the class average is even lower. I believe that what these results show is a poor perception of education from my classmates and I, which could probably be attributed to us being from philadelphia. Philadelphia has great colleges and universities, however, often times various neighborhoods lack access to quality schools.Since education isn't that great in America, I assumed that it was much worst in other countries which lead my results to be low compared to the correct answers.

i SLA la vila !

Science Leadership Academy (SLA) es pequeña comparado con otra escuela, pero la escuela es muy crearive y desafía.  Tenomos muchos de los diferentes deportes y desqués de la escuela. Hay casi siempre 600 estudiantes y 50 los prosfesoras. SLA está en Filadelfia 22nd y Arch AVE. A mí me encanta SLA. SLA profesores son muy inteligentes y estudiantes es muy simpátices

Hoy las imagenes de sla....
imgres-2
imgres-2
imgres
imgres

Clase:  Español

Profesor /a:  La Srta. Maunel

Actividades en la clase:  cantar, leer cuentos, hablar español, trabajar duro

Responsabilidades:  hacer la tarea, prestar atención, trabajar duro, estar preparada, y no hablar inglés.

Materiales: la carpeta, una computadora, las hojas de papel, una pluma o un lápiz.

Opinión: Me fascina porque es muy interesante

Clase: Bioqúimica

Profesor: El Sr.Sheriff 

Actividades en la clase: trabajar de groupo, projecto 

Responsabilidades: hacer la tarea, prestar atención, trabajar duro, estar preparada, y tomar apuntes

Materiales: la computadora 

Opinión:  Bioqúimica requerido much de trabajar de groupo

​Here are the venn diagram comparing the public high school in Philly and public high school on Spain.
Screen Shot 2012-02-05 at 8.18.49 PM

World of 100 Analysis

Religion world of 100
I think it's impressive as to how close the class is with every religion, except for buddhism, which somehow is off by about 10.
Languages(World of 100)
This is just about the opposite of religion, we are wrong on just about every single language. I think that should be put to the fact, that in America it really is a one language country (east coast at least), but in other countries there are many different languages from region to region.
Age of World
The class is wrong about everything, but I think it is mind-blowing that 65+ only makes up 8% of the population.
Analysis/Reflection
I am most accurate with religion, I don't know exactly what to attribute to it, but most of my answers were semi-guesstimates. I thought about all of my friends and how many people were the same religion and just hoped that I was right. I was most inaccurate with the language, I know that would be because I am not exposed to different languages regularly. At home, my parents speak english, with the occasional Ukrainian word here and there. In school, we speak english, although I did take a spanish class. It's just that in America we are very narrow minded about language, which if you never leave the U.S. makes sense, but in the middle east or most european countries, most people are bilingual (if not more languages.) 
The most-shocking, real answer has to be about the 8% of the population being older than 65, the average life span in America is about 75 years old, but in the rest of the world it is about 69 years old (researched after graphed.) I assumed that people just lived to about 80-85, pretty regularly. I was spot on in my guesstimates of how many speak chinese, that's because I took in to account they have two different languages, and they have more than a billion people, which is a huge percentage of the population.

World of 100 Analysis - Sanchez

Electricity Usage:

Electricity #1Electricity #2
My prediction about what percent of people in the world have electricity in their homes is completely opposite the actual amount of people that have and don't have electricity worldwide. My classmates were more accurate than I was with this prediction, but were still not right in their numbers. It turns out that more people have electricity in their homes worldwide than do people that don't have electricity in their homes. 

Geography:


Geography #1Geography #2

My Prediction on the distribution of people in the continents of the world was also inaccurate. My predictions were pretty similar to what my classmates thought in most cases for this category. In reality, there are a lot more people in Asia than there are in all of the other continents. Africa has the second highest population of people, Europe the third highest, Latin America the fourth highest, and North America is the continent with the least amount of people in the world. 

World Languages                                                                                                                                                           
Languages #1Languages #2
The Amount of people who speak other languages in the world is much higher than the amount of people that speak english, Chinese, or even Arabic. My numbers, once again, are the complete opposite of the actual data. 

Part 4: 

I was off on all of the categories that I graphed. Many times the numbers that I put down were completely opposite the actual data. I was very surprised to find out that more people in the world don't know English. A small 5 % of people in the world know English. More people in the world know Chinese, at 12%, than the percent of people who know English. I thought that because America is a pretty huge role model in world wide and because so many people of different countries come to America for work, that there would be a large amount of people who knew English around the world. Looking at the correct data, however, it makes sense that Chinese is spoken by a relatively big percent of the world population because of all of the business that cooks up in China. It also surprised me to find out that 78% of the world population have electricity in their homes. I guessed that about 30% of the same would have electricity at home because in my eyes, I have always seen countries like the United States, Europe, and some parts of Asia as rich, while other countries in Asia, Africa, the Caribbean, and Latin America were poor. I thought that there was only a small percent of people in the world in certain countries who could afford to have electricity in their homes, while the rest were too poor to afford it. I was wrong. I guess that the countries that were once underdeveloped and under-equipped have received help from more powerful allies and have been able to come up with the resources that they did not have before. Though I was off with my production of population distribution in world countries, I was not surprised to find that the largest percent of the world population lives in Asia. I am pretty sure this is because Asia is the largest continent covering the East side of the world. More countries are considered part of Asia than in any other continent. 


World Of 100 Analysis - Biello

We were given a worksheet that had multiple categories including, for example; gender, age, geography, religion, etc. But, we had to fill out each category with only 100 people in mind, dividing them up however we saw fit, hence the name "World of 100". 

POVERTY

Screen Shot 2012-02-09 at 8.57.49 PM
As you can see my answers were too high and too low for the class answer averages and the correct answer values. The thing I found most interesting about the graph however was the fact that less than 50 people were living on less than 2USD per day, I would've thought the number would be much higher. It is interesting also how the class's average was right in between the correct answers and my own. 

TECHNOLOGY (Cell-Phone Subscribers)

Screen Shot 2012-02-09 at 8.58.06 PM
My answers along with the class's answers were substantially incorrect by 20-30+ people, in both categories. I figured that a lot of the people around the world didn't have cell phones because there are a lot of 3rd world countries and some people in 2nd world countries might not even want phones, but my reasoning was incorrect. A vast number of people (when scaled down to 100 people) are cell phone subscribers across the world, interesting. 


TECHNOLOGY (Computers)

Screen Shot 2012-02-09 at 8.58.26 PM

My answers along with my classmates' answers were pretty close for non-computer owners. When I was picking the amount of people who didn't own a computer, I knew it'd be high because of the amount of inaccessibility people have to a luxury such as computers so I picked a high amount of people. But, according to the correct answer; that wasn't even high enough! My classmates, in my opinion, had the same reasoning and they were pretty close to the correct answers as well. 


Comparing My Answers to Correct Answers

Most of my answers weren't really close to the correct answers. This game is not as easy as it looks or sounds, it's actually pretty complicated. It really makes you think going from category trying to scale the entire world's population down to only 100 people. The categories that I was closest in my estimation to the correct answers were: gender, urban/rural, and computer owners. All of the other categories I was off pretty substantially. I think I was most accurate with gender because I thought you pretty much had to split it down 50/50 with a slight variation on one side. I had the same thought process with the urban/rural category. With the computer owners, I knew a lot of people in the world don't have access to computers so I knew the number of owners couldn't be anything huge, and I was correct! I was most inaccurate in the following categories: age and geography. I think I was wrong in age because I thought there would be a pretty much balanced amount of people in each age group with a little more in the 15-64+, which was the case. But, there were very little 65+, which I was severely incorrect in. For the geography category, I figured everybody would be really spread out so I made all of the groups 20 people. But, Asia took most of the people with 60, which blew my mind. That shows that a lot of the world's population is actually in the continent of Asia. One of the most shocking correct answers was definitely the Religion category. I was shocked to see that there were more Christians than Muslims, I thought it'd be the other way around. Another thing that I found pretty interesting and shocking was that Chinese (first language) was the highest amount of people. Looking at it now shows that China's population is massively huge as well as the language trickling down over the generations. This was a very interesting activity and a really good look at globalization. 


World of 100 Analysis

Below are three charts that represent what the world would look like in several categories if the entire population were only 100 people. The blue bars are my answers, the red bars are the average of all my classmates answers, and the yellow bar is the actual statistic.


chart_2

Personally I was surprised by how off I was with this prediction, I suppose I'm a bit (maybe a lot) of a pessimist, but when I think of large third world countries, I imagine the vast majority of those people do not have clean water (perhaps partially in thanks to large campaign fundraisers to help put pumps into third world country villages) and that it is rarer than it actually is.
chart_4
I was pleasantly surprised by how accurate I was with this prediction of mine. I expected that the majority of the population would be in the largest age bracket (15-64), and that there would be more children than seniors because as people grow old and die, obviously those numbers will decrease; morbid to say the least.
chart_6

Again, I was surprised by how many have access to electricity, I had previously believed it was a rarer commodity than it actually is.


  1. Which categories were you most accurate? inaccurate? Explain why you think that was the case.
    -I was most accurate when it came to the general age breakdown of the population. I believe this is because I have a pretty good grasp of how longevity breaks down and various generation booms. I was very inaccurate when it comes to access to various utilities (clean water and electricity). I think this is because I have the idea that America is the land of extravagance and luxury, and so I associate somethings we take for granted (clean water and electricity) as being rarer than they really are.
  2. Which of the real/correct answers shocked you the most? Explain.
    -I was surprised at how many people have access to electricity. I can see clean drinking water being relatively common because there are many relatively simple methods of purifying water (boiling comes to mind), but I have a hard time understanding how accessible electricity is. I imagine that electricity takes a huge infrastructure to provide for a town, but maybe it's more efficient than I had previously thought.
  3. If you were way off course in your predictions, explain why it is that you feel that happened. If you were spot on, explain why you think that happened.
    I was way off course for my predictions on access to clean water and electricity and I imagine I've developed a bit of a pessimistic view of the outside world. Not necessarily the idea that the U.S is the greatest country or anything like that, but really that clean water and electricity are more difficult to obtain. Also, when I hear about how many people live on less than $2 USD a day, I have a hard time imagining them paying for electricity on top of basic living expenses (food, clothing etc).

World of 100 Analysis

Languages in a world of 100:
Screen Shot 2012-02-09 at 7.08.56 PM

Technology in a world of 100:
Screen Shot 2012-02-09 at 7.09.09 PM

Country of Origin in a world of 100:
Screen Shot 2012-02-09 at 7.09.50 PM


Above are the charted/graphed results of my answers, the class averaged answers and the actual answers to the World of 100 survey we took on Wednesday morning in Globalization. My charts/graphs show the answers I chose, the averages of all of the class' answers, as well as the actual answers for the survey. The class averages and actual answers were actually, for the most part, pretty close in numbers. Mine, on the other hand, were way off when it came to them against the actual answers. 

I chose to focus on Language, Country of Origin, and Technology. The most accurate of my graphs I would have to say would be the Language portion of the survey. For all but a few of the answers, I was pretty close in range. I figured the most spoken language would have been English because a lot of countries in the world speak English as a language. I also thought that since a lot of countries speak English, that the majority of the people would be speaking English when they communicated with each other. That was just how I thought about it in my mind.
 
I would have to say that my most inaccurate graph would probably be the Country of Origin portion of the survey. I mean, I was pretty much just as inaccurate with the Technology, but since there were more options when it came to countries and only two for technology, I used the countries. I believe that I was inaccurate because I was thinking of the 100 people all living in North America in a civilization, rather than all over the world. I guessed that since most people who live in North America now were born here, that the majority of the 100 would be too. Sadly, I was wrong. It turns out that the majority of the people would be from Asia, which makes sense because countries in Asia, such as China and Japan, are overflowing with people. 

It was a HUGE shock for me when I realized that only 3/4 of the people would have cell phones and 1/4 wouldn't. I thought it would be more like 9/10 with cell phones and only 1/10 without. Since the majority of people now have cell phones, it really surprised me that the option for people with cell phones number wasn't higher. 

I think that I was way off on all of them because honestly, I didn't know. I wasn't sure about certain things like, if everyone was going be living in one country, if we were all spread out around the world, how much different would the world be from it is now, etc. It was kind of confusing. I wasn't spot on for any of them. It was kind of disappointing, but it was fun to learn some new and interesting facts from this assignment. 

World of 100

chart_1
Age was easier to guess because it follows a bell curve.  My main issue was over estimating the amount of elderly people alive, I was surprised to see how few there are. 
chart_1 (1)
For the world geography I seriously misjudged the distribution.  I put too many people in both North America and Europe.  I believe I did that because those are the two continents that have the closest links to me.  An other issue I have is over judging the size of Europe, I always think it's a lot bigger than it actually is.  Asia includes two highly populated countries, China and India, and also Russia which isn't exactly densely populated but it's huge. 
chart_1 (2)
I was pretty far off with the world languages.  I seriously underestimated the number people who would speak other languages and overestimated the number of English speakers.  I think my issue was similar to the one with geography; the languages that were listed were the common languages that you hear about.  There are hundreds of other languages that weren't listed, and many other countries that speak them.  I started out with the languages I knew best and then divided the remainder of numbers among the left overs such as Hindustani, Bengali, Malay-Indonesian and, other.  That process didn't exactly work out for me.

1.  I wasn't very accurate in my guessing, the worst were drinking water, technology, computer and cell phone owners and, education.  I think I was the furthest off on those because those are the "causes".  Those are the issues that are always brought up, that people don't have drinking water or access to technology or education and because of that I guessed the numbers far lower than they actually are.  I can't say that I've ever been extremely involved in helping to stop any of those"causes" so I didn't have a whole lot of knowledge on the subjects.  Because of my lack of knowledge I over estimated the scale of the issues.  The numbers that I guessed the closest were age, electricity and, religion, and I think the only reason I got close on those was because the statistics are easier to guess from previous knowledge.  Age you can guess mathematically, electricity I guessed from previous knowledge and religion is easier to guess because it's an issue that's constantly being discussed.

 
2.  I was most surprised by technology, education and, literacy, I thought those would have been a lot lower than they actually were.  I was surprised by how many people have access to technology seven times as many people as I predicted are cell phone subscribers, two times as many people as I predicted would be active internet users and five times as many people out own or share a computer.  I really had no idea that many people had access to technology.  I was also surprised by the number of people that would be educated and literate.  I was also surprised by how little the difference was in education between men and women.
 
3.  I was generally pretty far off, I think it's because I don't have the best view of the rest of the world.  I'm afraid that I have the classic American belief that most people speak English, live in North America and have worse conditions than us.  I always thought that I had a better view of the world distribution but I guess that's not true.  I don't think that I'm alone in having off numbers base on ones own world.  People expect the rest of the world to be like where they live, that's just human nature. 

¡Mis Clases Favoritas!


Mi escuela, Science Leadership Academy, es muy diferente para otras escuelas publicas en Filadelfia. Tenemos que aplicar. Todo el mundo  es extraño, los profesores también! La vida en SLA es loca y divertida. Tenemos  mucho actividades. Tenemos el biblioteca y salón música. Hay quinientos estudiantes, es Pequeño para las otras escuelas. Esta en el centro de la cuidad. Me encanta SLA porque aprendemos mucho y tenemos que trabajar duro.

rocket_lettering
rocket_lettering
sp1036technicallyphillyindivfeaturehallway

Clase : Poesía

Los Profesores :El Señor Kay y La Señorita Gina

Actividades en la clase: escribimos 

Responsabilidades: tenemos que tener posturas positiva

Materiales: el cuaderno, una pluma o una lápiz , 

Opinión: Me caen bien porque es divertida

Clase: ​Geometría

 La Profesora : La Señorita Thompson

Actividades en la clase: resolver los problemas, dibujar 

Responsabilidades: Hacer todos tarea, prestar atención, coger un buena nota en las pruebas y participar activamente

Materiales: La carpeta, unas hojas de papel, la computadora (a veces)

Opinión: Me fascina la clase de geometría porque aprendemos mucho.

​Un comparación de las  escuelas publicas en Filadelfia y Paraguay. 
Screen Shot 2012-02-07 at 10.17.15 AM

mi vida escolar


DISCRIPCION OF SLA 

SLA es muy pequeño. Hay sólo quinientos estudiantes y vientecinco profesares. El café es mediano. SLA es muy interesante porque es muy diferente comparada con otros escalas. SLA tiene mocho clubs. Mi encantada SLA porque nosotros tenemos liberta. Sla ha un programa llamar EduCon. En EduCon gente de todo por acercarse observe our school.  


Screen Shot 2012-01-30 at 10.14.27 AM

World of 100

In our globalization class, we did a study on how the world would be divided if there were only 100 people. We'd first would make and estimation on the how the world would be in different categories such as what would be the most popular religion, poverty, etc. Then we would take a look at what the class came together as a collective average. We would compare both these numbers to the real percentages of numbers. In my data, I have come to see that my numbers were much closer to the class average then to the real numbers. None of my estimations came close to the real numbers. I think this is the case because I was a little more bias in my estimates. For example with geography, I choose to use africa as the place where the most people are from. But in the other categories, my classmates and I were very close in our predictions. I think this was possibly the case because of the way we are living today and how we live our lives. We only have a single story of what the rest of the world is like compared to our own. The numbers that I really found stagering was the amount of people that would be from North America. My instincts would tell me that the source of life is from Africa, and that is what shifted my thoughts. My estimations weren't completely off, but they were definitely not close to what I expected them to be. The reason I think we chose the numbers we did was because of the way we live today and the different views we the world. 
chart_8
chart_8
chart_7
chart_7
chart_7 (1)
chart_7 (1)

World of 100 Analysis


Ages ALL

Though the only correction I had was my choice of 0-14(28) being close to the right answer of 0-14(32), I had he right concept where 15-48 would be majority of the 100, 0-14 will be the 2nd rank, and 55+ is minority of the 100. I was not too shocked with the real/correct answers for the ages. Like I mentioned earlier, both my choice and the right answer had the same concept. Why I think this correct concept would be of the ages is because the ages between 15-48 are like the in betweens of the ages. Like you're growing towards your young adult hood and living your "mid-life" where as to the ages between 0-14 are just too young but there are a lot of kids and 55+older...not to sound cruel but going back to like the previous centuries not as much of us were able to have access to the proper medicine and just new diseases that we were exposed too. So around those centuries, it was common for majority of 55+ to die at a young old age. 


Geography ALL

The right answer for geography was too much of a shock for me. Asia with 60% of the population can be true but I would of thought that Africa would have more people than Asia. My answers were the total opposite of the right answers.


Languages ALL

Other language was one of my low choices but came to be the opposite of the right answer. I would expect that either chinese, english, or spanish would be the most spoken language but it came to be the few.